
Appearance
Stock Value Report (Lytning Analytics)
Use this page when you need the total value of the stock you currently hold, broken down by category or location, so you can compare it against your last stock take or the balance sheet.
Goal
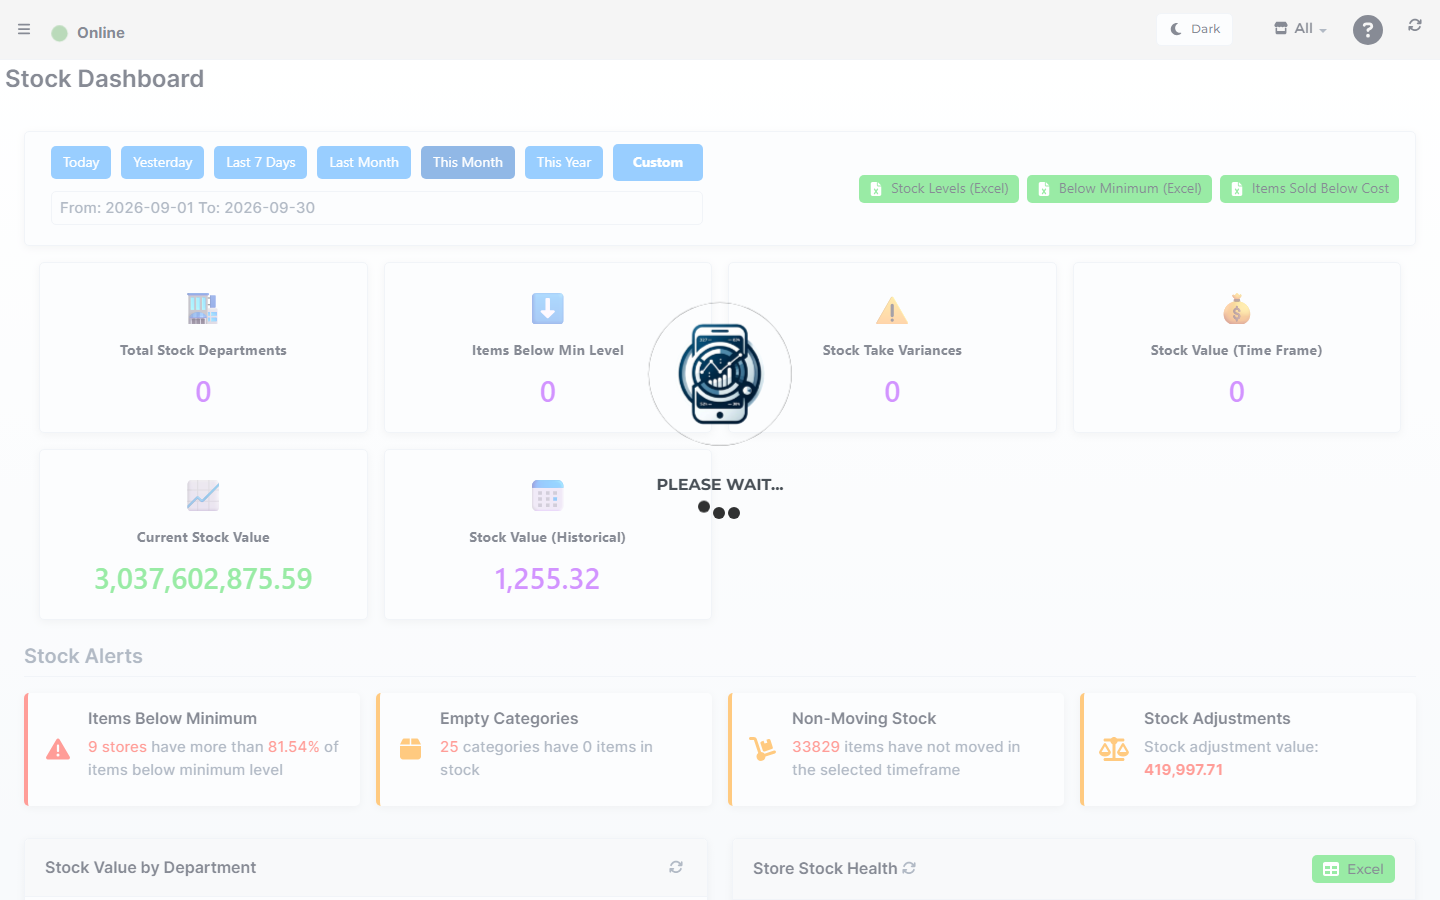
Lytning Analytics demo store — screens may differ slightly by version.
You need the total stock value (and the breakdown by category) for the store or franchise as of today, so you can reconcile against your last stock take, the balance sheet, or your accountant's figure.
Where this happens
- In the Core App: open Reports & Analytics → Stock Value (top-level sidebar group).
- Direct URL:
https://analytics.pos.co.zm/stock-reports(opens the Stock Reports landing page — the Stock Value tile lives here, not on its own route).
Prerequisites
- You are signed in to the Core App as supervisor or franchise admin.
- Your role has Reports permissions.
- Pop-ups are allowed for the Core App URL.
- Stock items have a cost price recorded (items without a cost price do not contribute to the stock value).
Steps
1. Open Stock Reports from the Core App
- In the Core App sidebar, open Reports & Analytics.
- Click Stock Value. The page that loads is the Stock Reports landing page — the Stock Value tile is one card among several.
- A new browser tab opens at Lytning Analytics, signed in.
2. Pick the date range
- Choose a Timeline preset: Today, Yesterday, Last 7 Days, Last Month, This Month, or This Year.
- To pick a custom range, click the Custom button, then enter Start Date and End Date and apply.
- Confirm the displayed
From: YYYY-MM-DD To: YYYY-MM-DDline before reading the figures.
3. Read the stat-cards
The page shows three stat-card rows at the top:
- Stock Information — three tiles:
- TOTAL STOCK COUNT — total active items.
- ITEMS BELOW MINIMUM — items at or below the minimum level, with a percentage badge; clicking navigates to ReOrder Stock Reports.
- STOCK VARIANCES — stock-take variance, with a percentage badge; clicking navigates to StockTake Reports.
- Financial Information — two value tiles plus a store filter:
- STOCK VALUE — the total inventory value. Clicking opens the Stock Value PDF in a new tab.
- SELLING POTENTIAL — total potential revenue at selling prices.
- Filter by Store: a dropdown defaulting to All Stores. Pick one store and a Filtered Value: line appears under the dropdown with the scoped total. The caption is hidden while All Stores is selected.
- Other Information — one tile:
- PENDING PURCHASE ORDERS — pending PO count; clicking navigates to Purchase Orders.
4. Open the Stock Value PDF
There are two ways:
- Click the STOCK VALUE tile under Financial Information.
- Or scroll to the Quick Stock Reports card, find Stock Value under Inventory Analysis, and click it.
Either way the Stock Value PDF opens in a new tab.
5. Drill into a sub-report
Click one of the report links to navigate to the report:
- Quick Stock Reports grid (categories Inventory Analysis, Purchasing & GRV, Department & Stock Management): Fast Moving Stock, Slow Moving Stock, Stock Value, GRV Combined, Purchase Order, Overdue GRVs, Department Performance, Department List, Stock Movement, Stock Expiry.
- Stock Reports records card: GRV (GRN) Reports, ReOrder Stock Reports, Stock History, Stock Adjustment, StockTake Reports, Received Transfers, Sent Transfers.
Expected result
- The page shows TOTAL STOCK COUNT, ITEMS BELOW MINIMUM (with %), STOCK VARIANCES (with %), STOCK VALUE, SELLING POTENTIAL, and PENDING PURCHASE ORDERS.
- The Filter by Store dropdown narrows Stock Value to a single store; the Filtered Value caption shows the scoped total.
- Clicking STOCK VALUE opens the Stock Value PDF in a new tab.
Edge cases
- The new tab does not open. Allow pop-ups for the Core App URL and try again.
- You land on the Analytics sign-in page. Sign back in to the Core App and open the report again.
- The Stock Value tile is empty. Confirm the Timeline preset is set and that the store has active items with cost prices recorded.
- The Filtered Value stays empty after picking a store. The dispatched
getTotalStockValueByStoreaction failed — check the console; the dropdown otherwise remains set and the Filtered Value stays null. - The value looks too low. Items with no cost price recorded do not contribute. Ask your supervisor to add cost prices under Stock Management → Edit Stock.
- The value looks too high. Confirm there are no orphan items (zero on-hand but still active) — they should be archived.
- The value differs from the balance sheet. Confirm the Timeline date range and the cost-price basis your accountant uses (some accounts use last-cost, some use average cost).