
Appearance
Sales Reports (Lytning Analytics)
Use this page when you need to read sales totals for a store or franchise, break them down by period, cashier, category, or item, and export the result.
Goal
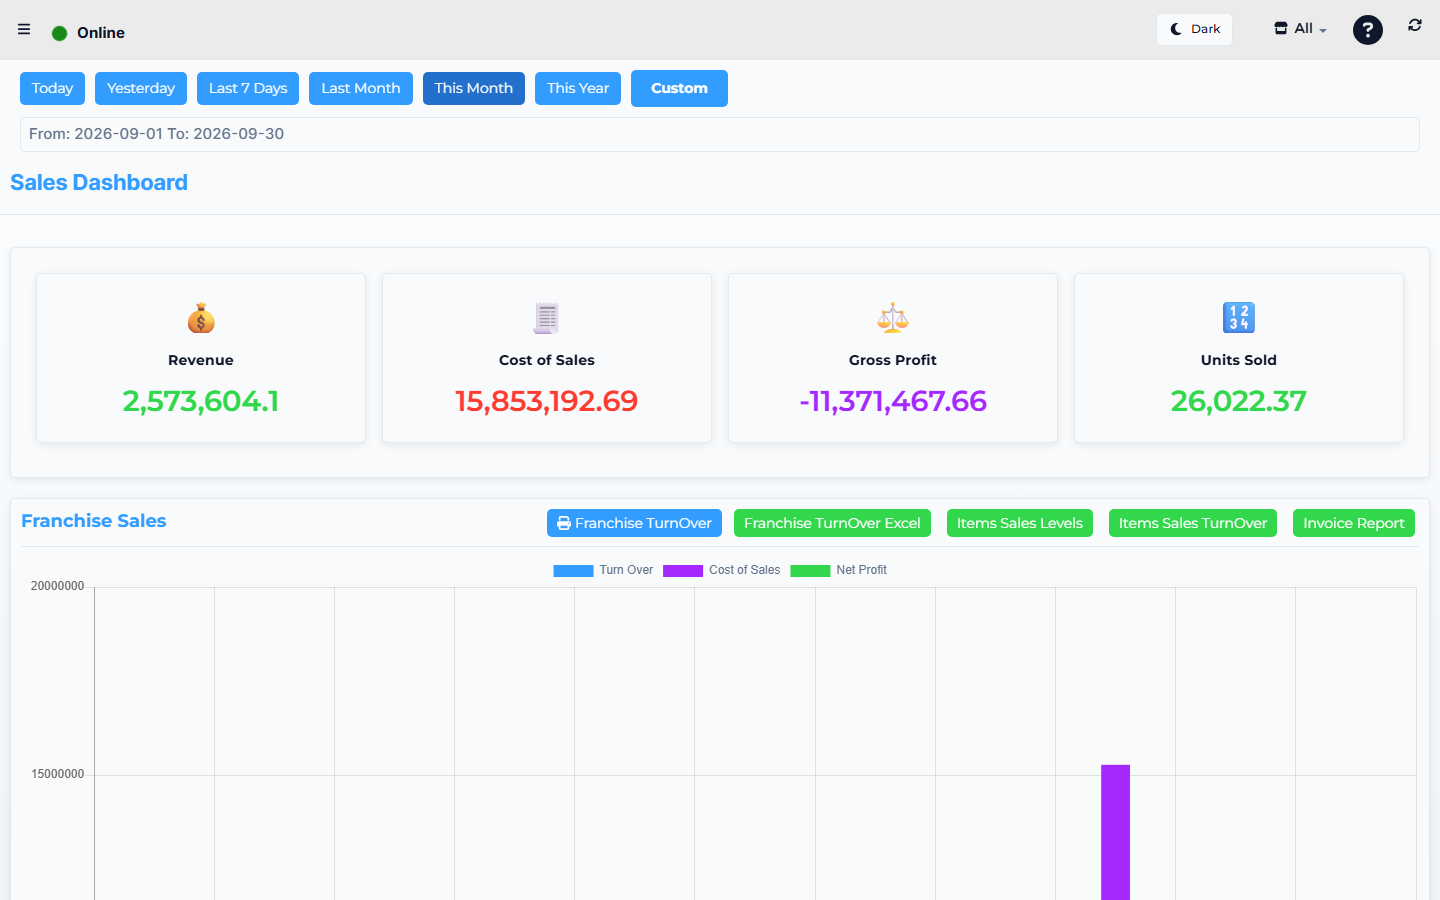
Lytning Analytics demo store — screens may differ slightly by version.
You need a sales report for a chosen period, broken down the way your franchise asks for it (totals, by cashier, by category, by item), so you can reconcile the till against expected takings.
Where this happens
- In the Core App: open Reports & Analytics → Sales Reports (top-level sidebar group).
- Direct URL:
https://analytics.pos.co.zm/sales-reports(opens the same report in a new tab; single-sign-on signs you in).
The Core App sidebar is the supported entry point; the direct URL works if your session is still active.
Prerequisites
- You are signed in to the Core App as supervisor or franchise admin.
- Your role has Reports permissions.
- Pop-ups are allowed for the Core App URL.
- You know the date range, store, and the breakdown you need (cashier, category, item, store).
Steps
1. Open Sales Reports from the Core App
- In the Core App sidebar, open Reports & Analytics.
- Click Sales Reports.
- A new browser tab opens at Lytning Analytics, signed in.
2. Pick the date range
- Choose a Timeline preset: Today, Yesterday, Last 7 Days, Last Month, This Month, or This Year. Clicking a preset commits the from/to range and reloads the page.
- To pick a custom range, click the Custom button. The picker drops down with Start Date and End Date fields; enter both, then click the confirm button to apply.
- Confirm the displayed
From: YYYY-MM-DD To: YYYY-MM-DDline before reading the figures. The range is carried through to every report you open from this page.
3. Read the stat-card tiles
The page shows two stat-cards at the top:
- Financial Information — three tiles:
- REVENUE — total sales value for the period.
- COST OF SALES — cost of goods sold for the period.
- GROSS PROFIT — revenue minus cost of sales.
- Sales Information — two tiles:
- UNITS SOLD — total units sold.
- TOP SELLING CASHIERS — the top-performing cashier names for the period, listed in rank order. Click a name to open that cashier's sales details.
4. Generate a Quick Sales Report
- Scroll to the Quick Sales Reports card.
- In the Quick Printable dropdown, pick a report. The dropdown lists exactly these 15 reports:
- Sales Per Cashier, Sales Per Waiter, Cashier Department Sales, Best Sellers, Turnover, Worst Sellers, Department Performance, Sales Per Computer, PC Department Sales, Inactive Performance, Sales Summary, Hourly Sales Report, Daily Overview Report, Average Hourly Sales, Business Overview.
- Optionally set From and To datetime-local inputs to override the printed period.
- Click Print. The report opens as a PDF in a new tab.
5. Export Department Sales Details to Excel
- Scroll to the Department Sales Details card.
- In the Filter by Department dropdown, pick a department (defaults to All).
- Click Export to Excel. An Excel file downloads with the columns Item Name, PLU, Invoice Number, User, Time, Department.
6. Drill into a sub-report
Click one of the report cards to navigate to that report:
- Department Performance - All Stores → multi-store department performance view.
- Top sell by category → fast-moving stock by category.
- Online vs Offline Sales → online vs offline comparison.
- Sales by Cashiers → cashier-by-cashier breakdown.
- Sales By Sales Person → sales-person breakdown.
- View Invoices → invoice list and reprint.
Expected result
- The page shows REVENUE, COST OF SALES, GROSS PROFIT, UNITS SOLD, and TOP SELLING CASHIERS for the chosen period.
- The Timeline header line confirms the period you picked.
- A Quick Printable report opens as a PDF in a new tab.
- A Department Sales Details export downloads as an Excel file with the six columns above.
- Each sub-report card opens the matching report page.
Edge cases
- The new tab does not open. Your browser is blocking pop-ups for the Core App URL; allow pop-ups and try again.
- You land on the Analytics sign-in page. Your Core session expired; sign back in to the Core App and open the report again.
- The report is empty. Widen the date range; confirm the store filter; confirm sales were saved (not just held on the till).
- Totals do not match the till. Recount: compare REVENUE (this page) with Net takings (Store Cashups). Check for offline sales that have not yet uploaded — see Working offline.
- A sub-report card won't open. Some cards need a specific store selected; the page checks whether a store is selected and shows a toast asking you to pick a store first.
- The Print button on a Quick Printable reports "Export Not Available". The selected report has no
routeconfigured in thereports[]list and is print-disabled.